
Reaction Time Test
How quickly can you react? Wait for the box to turn green, then click, tap or press the space bar as fast as you can. After five rounds you get your average and best reaction time in milliseconds, a chart of every attempt, and a comparison with typical ranges. Switch to sound mode to test your reaction to a beep instead.
- Free to use
- No sign-up
- Runs in your browser
Reaction time test
Reaction Time Experiment Kit
Reaction time experiment worksheet, Excel results table with averages and chart, ruler drop conversion chart, class results graph template and a training log.
- Experiment worksheet (DOCX/PDF)
- Results table (XLSX)
- Ruler drop chart (PDF)
- Training log (PDF, XLSX)
Formats: PDF, DOCX, XLSX. Instant download after payment (link valid 72 hours, up to 5 downloads). AI-assisted: the templates were drafted with AI help and reviewed and laid out before publishing.
$5.00 USD, one-time 4 files · about $1.25 each
- Instant download
- 7-day refund
- Secure checkout by Stripe
7-day money-back guarantee. Full refund within 7 days of purchase, even after you download.
Free sample: Reaction Experiment (PDF, 104 KB)
Full refund within 7 days — see the refund policy and license.
Free printables
Single sheets you can print right now, no sign-up. The full pack adds every sheet in one download plus the editable files.
 Printable Reaction Time Investigation Worksheet
 Printable Reaction Time Results Table
 Printable Ruler Drop Reaction Time Chart
 Printable Reaction Time Training Log
What reaction time measures
Simple reaction time is the delay between a signal — a light, a colour change, a sound — and your response. It includes the time for your eyes or ears to detect the signal, for nerves to carry it to the brain, for the brain to decide to act and for the command to reach your muscles. A single click involves all of these, which is why even very fast people rarely go below about 150 milliseconds.
Typical reaction times
| Test | Typical range in online tests |
|---|---|
| Visual (colour change) | about 200–300 ms |
| Sound (beep) | often slightly faster than visual |
| Choice reaction (pick the right key) | longer — often 350 ms or more |
| Driving: seeing a hazard and braking | often 1 second or more in real conditions |
Online results include delays from your mouse, keyboard, screen refresh and browser, so they are usually a little slower than laboratory measurements. Compare yourself on the same device rather than with other people’s scores.
How to take the test
- Choose visual or sound mode and the number of rounds.
- Click the box (or press the space bar) to start a round.
- In visual mode, wait until the box turns green, then click as fast as you can. In sound mode, click when you hear the beep.
- Clicking too early counts as a false start and the round restarts.
- After the last round you get your average, best and median times and a chart.
For fair results, use the same hand, sit comfortably and avoid distractions. The timer uses your browser’s high-resolution clock; nothing is uploaded.
Worked example
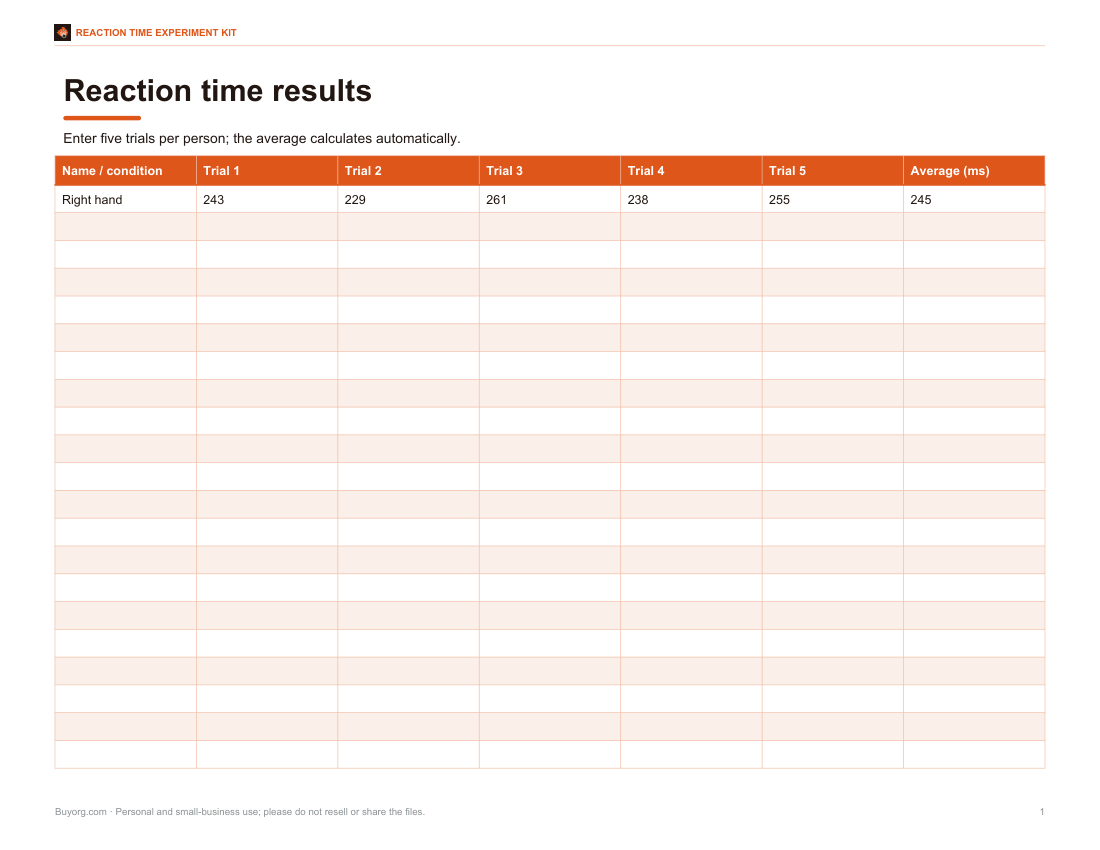
A student does five visual rounds and scores 243, 229, 261, 238 and 255 ms. The average is 245 ms, the median 243 ms and the best 229 ms — in the “fast” band. They then try sound mode and average 214 ms, a little quicker than for the colour change, which is a common finding. The next morning, after a short night’s sleep, their visual average is 281 ms.
What affects reaction time
- Tiredness: lack of sleep slows reactions noticeably.
- Age: reaction time is typically fastest in early adulthood and slows gradually with age.
- Practice and warm-up: the first few attempts are often slower.
- Distraction and phones: divided attention lengthens reaction time — a key reason not to use phones while driving.
- Alcohol and some medications: can slow reactions markedly.
- Anticipation: guessing leads to false starts; the random delay stops you predicting the change.
Reaction time in everyday life
Reaction time matters in sport, driving and gaming. A sprinter who reacts to the starting gun in less than 0.1 seconds is treated as a false start in athletics, because such a fast response is considered anticipation rather than reaction. In driving, total stopping distance includes the thinking distance travelled during your reaction time: at 50 km/h (about 31 mph) a car covers about 14 metres every second, so an extra quarter-second of delay adds roughly 3.5 metres before the brakes even start working.
Making the test fair
Small details change results: a wireless mouse may add latency, a high-refresh screen shows the colour change sooner, and background apps can delay the browser. Take the test in the same place, with the same device and hand, and do a couple of practice rounds first. Averages over five or ten rounds are far more reliable than a single fastest time.
Simple vs choice reaction time
This test measures simple reaction time: one signal, one response. Choice reaction time — for example pressing a different key for red and blue — is longer because the brain must first decide which response to make. The more choices there are, the longer it takes, a relationship known as Hick’s law. That is one reason why clear, simple signals matter in safety design.
A classroom experiment
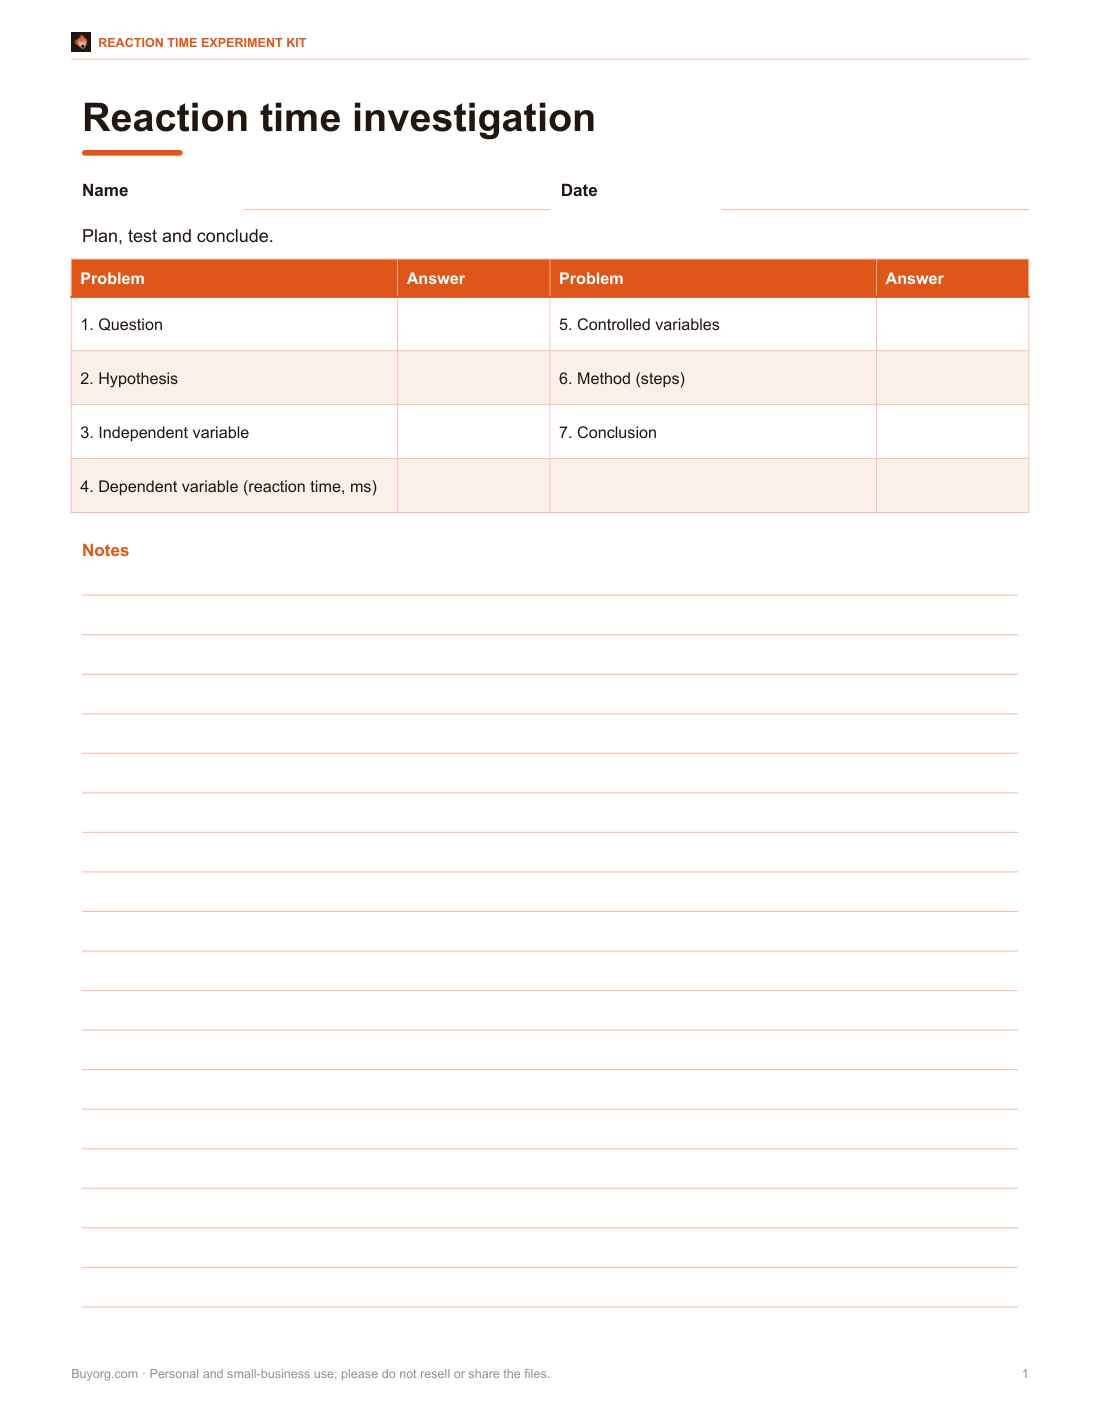
Reaction time tests make a simple science investigation. Students can test one variable at a time — dominant vs non-dominant hand, sound vs light, before and after exercise, with and without a distraction — using the same device and the same number of rounds. The experiment worksheet in the template pack guides students through a hypothesis, method, results table, average calculation and conclusion.
The ruler drop test
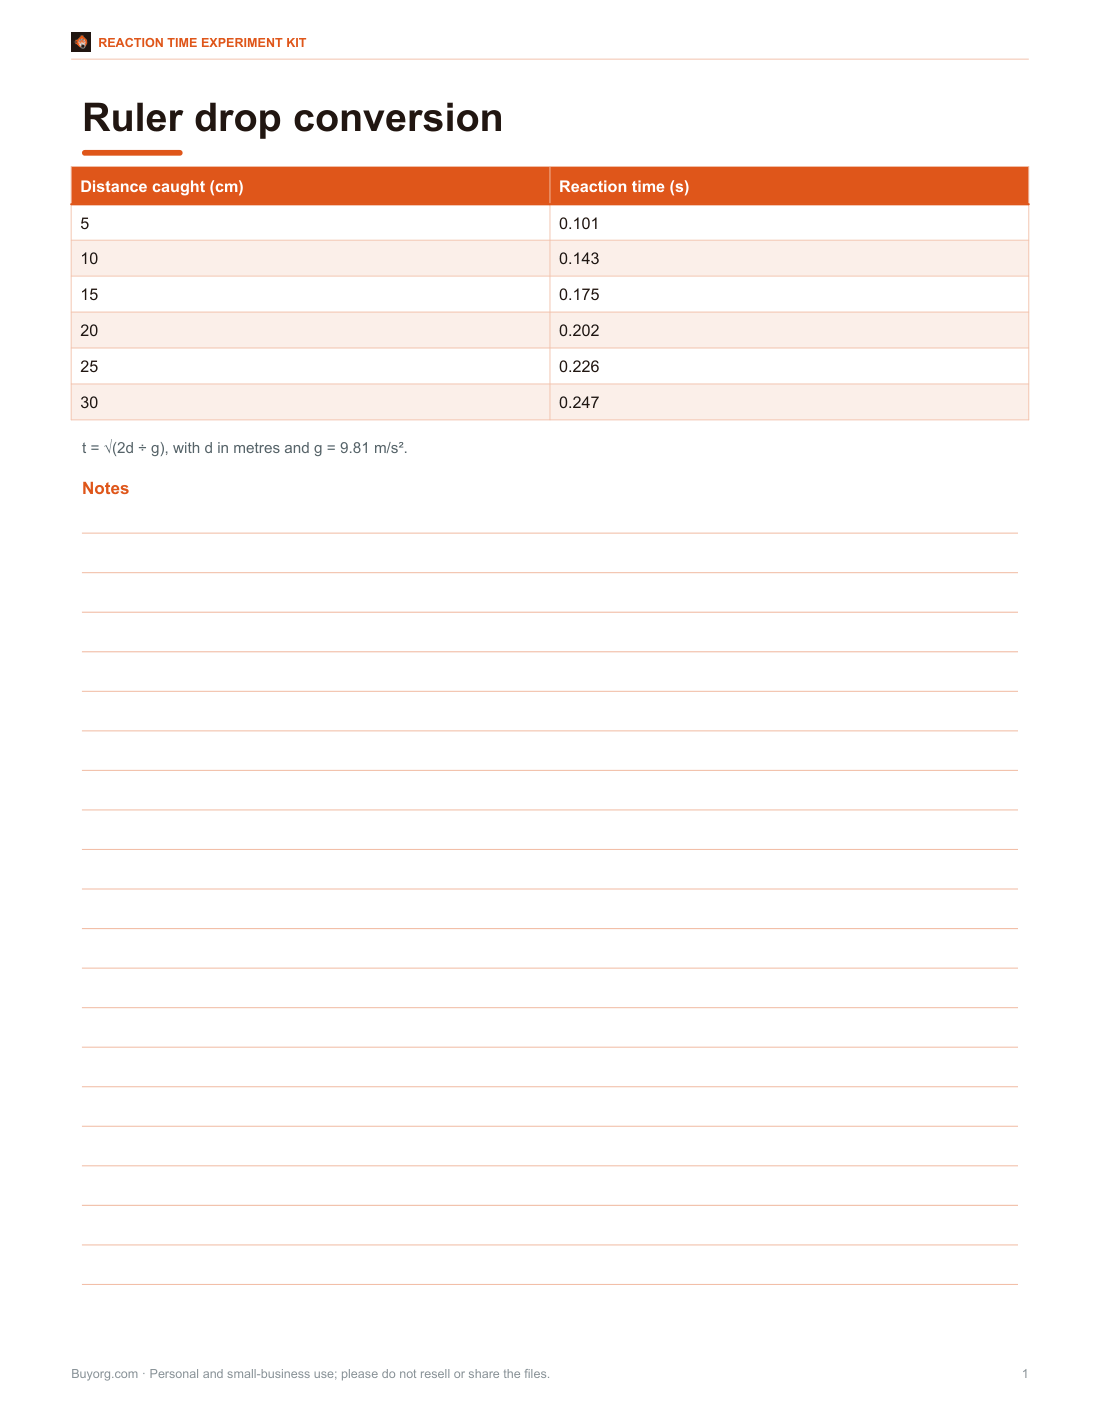
Without a computer, try the classic ruler drop: a partner holds a 30 cm ruler vertically with the zero mark between your thumb and finger, then drops it without warning; you catch it as fast as possible. The distance it falls gives your reaction time using t = √(2d ÷ g): a catch at 15 cm means about 0.17 seconds. The pack includes a conversion table.
The printable templates
The template pack includes a reaction time experiment worksheet, a results table with averages (Excel), a ruler drop conversion chart, a class results graph template and a training log for sports and gaming practice.
Frequently asked questions
What is a good reaction time?
Around 200–250 ms is fast for an online visual test.
Why is my reaction time slower on some devices?
Mice, keyboards, screens and browsers add different delays.
Is reaction to sound faster than to light?
Often slightly, in simple reaction tests.
What is a false start?
Clicking before the signal; that round is restarted.
Can I improve my reaction time?
Sleep, warm-up and practice help; tiredness and distraction make it worse.
Is my data saved?
No, results stay on the page only.
Does practice improve reaction time?
A little, mostly by improving focus and consistency; sleep and alertness matter more.
Why does the delay before green change?
A random delay stops you anticipating the signal.